> ## Documentation Index
> Fetch the complete documentation index at: https://docs.perfai.ai/llms.txt
> Use this file to discover all available pages before exploring further.
# Apps
> The Apps page is your central hub for managing every application under test — tracking scan history, security posture, and savings across your entire portfolio.
 ## What is the Apps page?
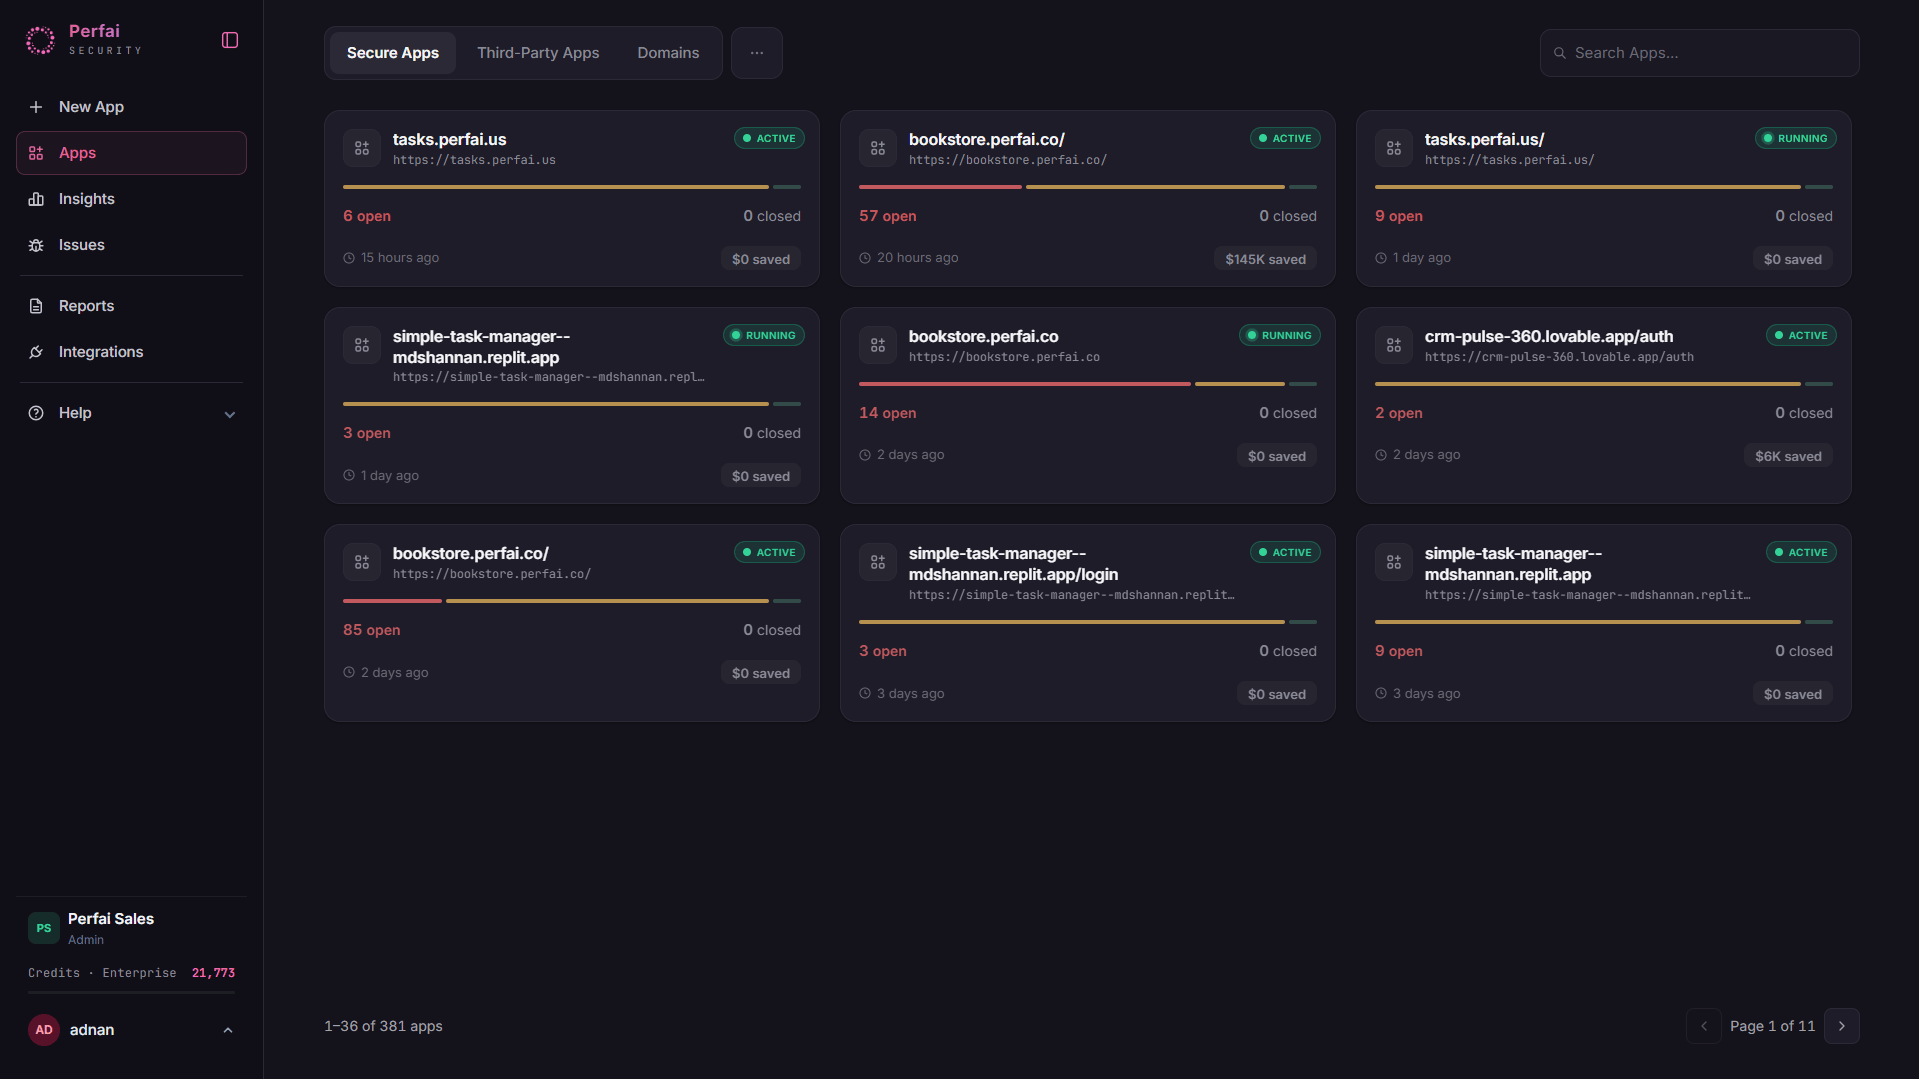
The **Apps** page gives you a bird's-eye view of every application Perfai is testing. Each app card shows its current security status, when it was last scanned, how many issues were found, and how much in potential bug bounty costs have been avoided.
From here you can launch new scans, open individual app dashboards, and track progress across your entire portfolio in one place.
***
## Adding your first app
Click **+ New App** in the left sidebar or the button at the top right. Paste your app's URL into the input field — that's all you need.
## What is the Apps page?
The **Apps** page gives you a bird's-eye view of every application Perfai is testing. Each app card shows its current security status, when it was last scanned, how many issues were found, and how much in potential bug bounty costs have been avoided.
From here you can launch new scans, open individual app dashboards, and track progress across your entire portfolio in one place.
***
## Adding your first app
Click **+ New App** in the left sidebar or the button at the top right. Paste your app's URL into the input field — that's all you need.
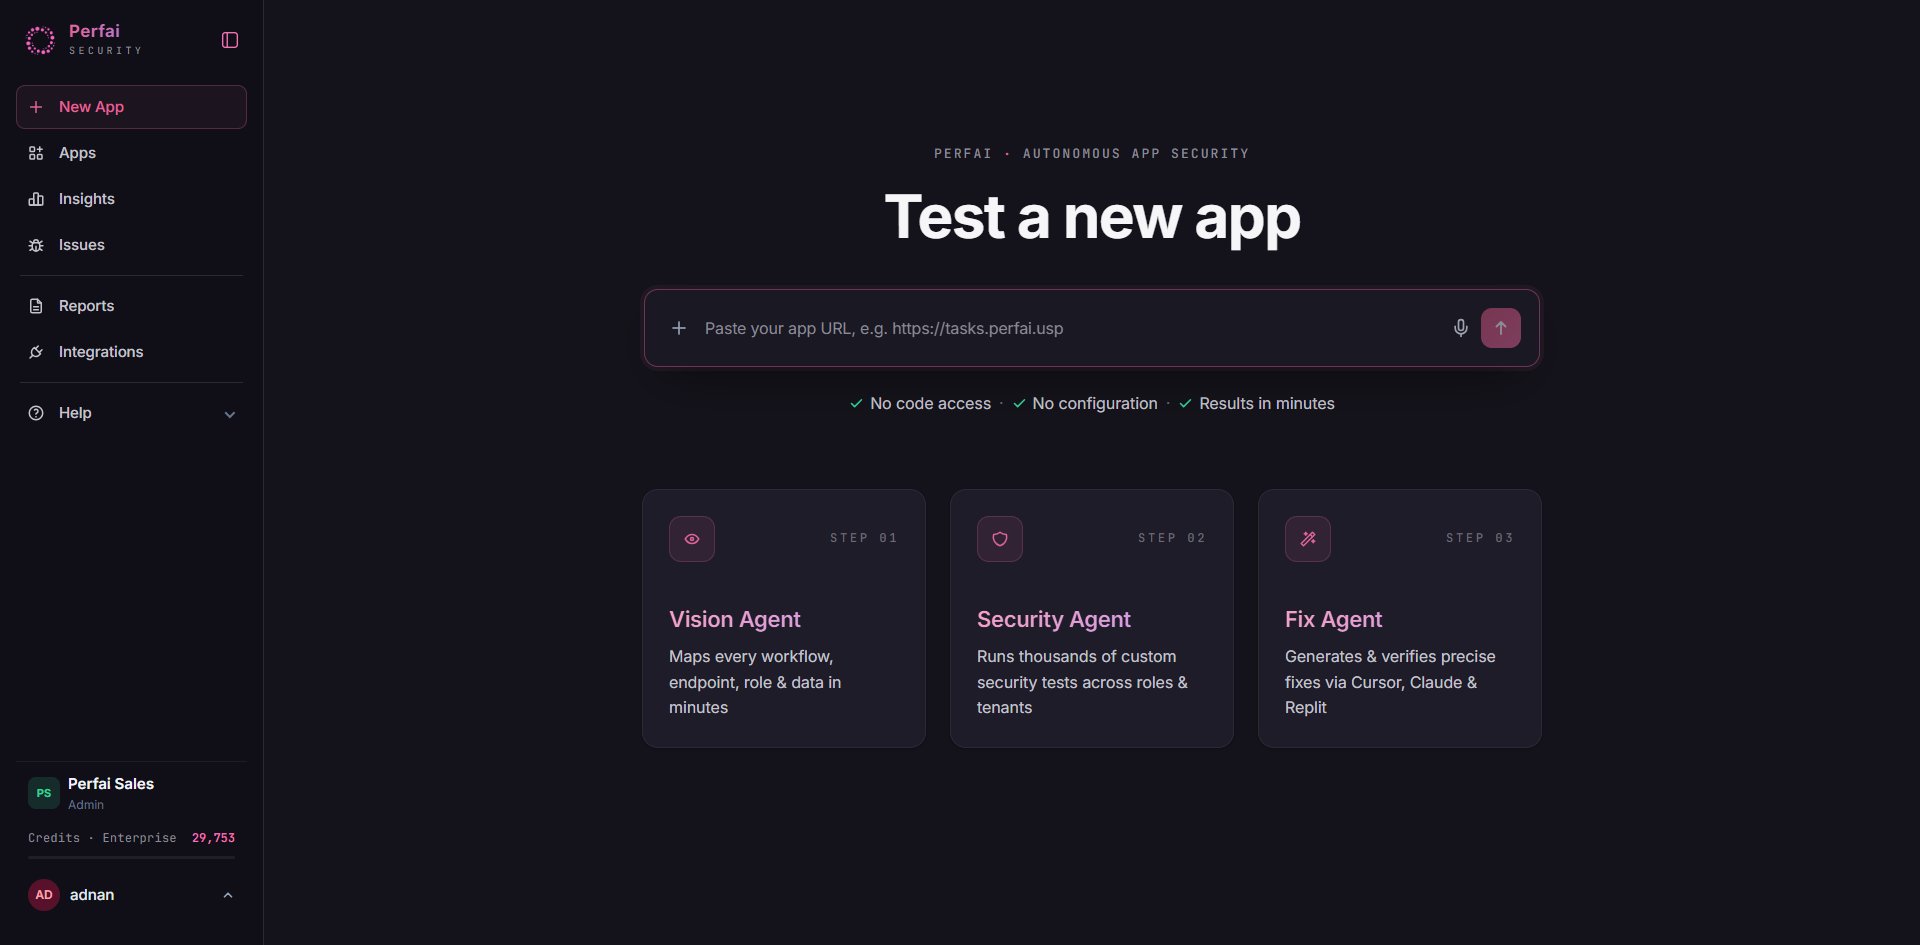 ```
No code access · No configuration · First report in 5 min
```
Perfai handles the rest: account creation, role discovery, attack surface mapping, and security testing — all automatically. See the [Quickstart](/docs/quickstart) for the full walkthrough.
***
## App cards
Each card in the grid shows everything you need to assess an app's status at a glance:
| Element | What it means |
| ------------------ | ------------------------------------------------------------------------------------------------- |
| **App name & URL** | The registered application |
| **Progress bar** | Color-coded severity distribution of open issues — red (critical), orange (high), yellow (medium) |
| **Issue count** | Total open findings from the latest scan |
| **Last scanned** | How recently the app was tested (e.g., "13 mins ago", "3 days ago") |
| **\$ saved** | Estimated bug bounty value of issues found — what it would have cost if discovered externally |
Cards with a spinner indicator are currently running a scan.
***
## App types
The Apps page has three tabs:
Your own applications — the primary focus of security testing. Perfai maps these end-to-end and runs full permission testing.
External or vendor applications your team depends on. Perfai can test these too — important for supply chain security.
Domain-level tracking. Useful for organizations managing multiple subdomains or environments under a single parent domain.
***
## Why this matters
The Apps page answers the question your security team and engineering leaders ask most: **"What's our actual exposure right now?"**
* See at a glance which apps are clean, which are actively being scanned, and which have unresolved critical issues
* Track the dollar value of vulnerabilities found before attackers or bug bounty hunters did
* Identify apps that haven't been scanned recently and may have drifted out of coverage
Apps with a fully red progress bar need immediate attention — all their open issues are critical severity. Click the card to open the app dashboard and start triaging.
***
## Opening an app
Click any app card to open its full dashboard, which includes:
* **Overview** — security risk summary, attack surface coverage, and savings
* **Security** — detailed issue list with filters by severity and type
* **Vision** — live agent stream and task graph showing what's being mapped
From the app dashboard you can also trigger manual scans, configure roles, adjust the scan schedule, and export reports.
```
No code access · No configuration · First report in 5 min
```
Perfai handles the rest: account creation, role discovery, attack surface mapping, and security testing — all automatically. See the [Quickstart](/docs/quickstart) for the full walkthrough.
***
## App cards
Each card in the grid shows everything you need to assess an app's status at a glance:
| Element | What it means |
| ------------------ | ------------------------------------------------------------------------------------------------- |
| **App name & URL** | The registered application |
| **Progress bar** | Color-coded severity distribution of open issues — red (critical), orange (high), yellow (medium) |
| **Issue count** | Total open findings from the latest scan |
| **Last scanned** | How recently the app was tested (e.g., "13 mins ago", "3 days ago") |
| **\$ saved** | Estimated bug bounty value of issues found — what it would have cost if discovered externally |
Cards with a spinner indicator are currently running a scan.
***
## App types
The Apps page has three tabs:
Your own applications — the primary focus of security testing. Perfai maps these end-to-end and runs full permission testing.
External or vendor applications your team depends on. Perfai can test these too — important for supply chain security.
Domain-level tracking. Useful for organizations managing multiple subdomains or environments under a single parent domain.
***
## Why this matters
The Apps page answers the question your security team and engineering leaders ask most: **"What's our actual exposure right now?"**
* See at a glance which apps are clean, which are actively being scanned, and which have unresolved critical issues
* Track the dollar value of vulnerabilities found before attackers or bug bounty hunters did
* Identify apps that haven't been scanned recently and may have drifted out of coverage
Apps with a fully red progress bar need immediate attention — all their open issues are critical severity. Click the card to open the app dashboard and start triaging.
***
## Opening an app
Click any app card to open its full dashboard, which includes:
* **Overview** — security risk summary, attack surface coverage, and savings
* **Security** — detailed issue list with filters by severity and type
* **Vision** — live agent stream and task graph showing what's being mapped
From the app dashboard you can also trigger manual scans, configure roles, adjust the scan schedule, and export reports.