> ## Documentation Index
> Fetch the complete documentation index at: https://docs.perfai.ai/llms.txt
> Use this file to discover all available pages before exploring further.
# Insights
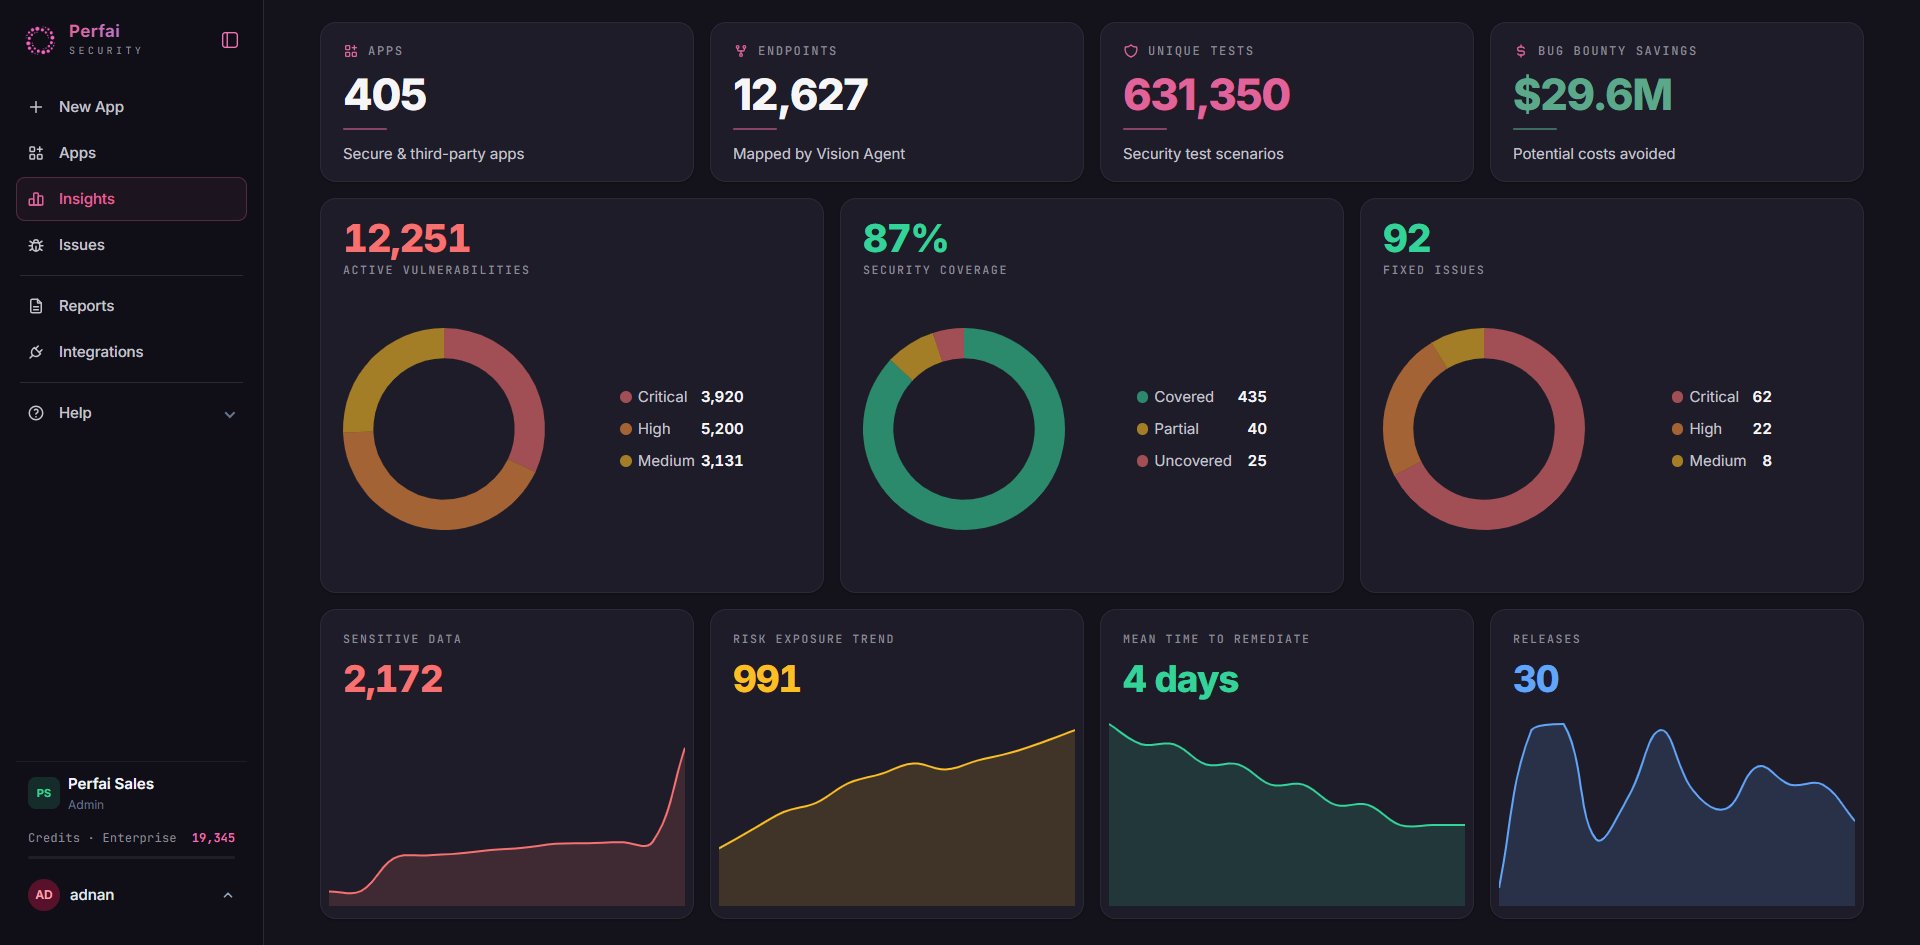
> Insights gives you a real-time security dashboard across every app in your portfolio — vulnerabilities, coverage, remediation velocity, and financial impact all in one view.
 ## What is Insights?
**Insights** is your organization's security command center. While the Apps page shows you individual app status, Insights aggregates everything across your entire portfolio into a single dashboard — so you can answer high-level questions instantly:
* How much of our attack surface is actually covered?
* How many active vulnerabilities do we have right now?
* How fast are we fixing issues?
* What's our total financial risk exposure?
***
## Top-level metrics
The four headline numbers at the top tell the story of your security program at a glance:
Total secure and third-party apps under active testing. Every app Perfai monitors contributes to this count.
Total API endpoints mapped by the Vision Agent across all apps. This is your real attack surface — not an estimate.
Total security test scenarios executed. Each test probes a specific permission boundary across a workflow, endpoint, and role combination.
Estimated value of vulnerabilities found internally before external researchers or attackers discovered them. This is the ROI number to show your CFO.
***
## Active vulnerabilities
The **Active Vulnerabilities** donut breaks down your current open findings by severity:
| Severity | Count | What it means |
| --------------- | --------- | ------------------------------------------------------------ |
| 🔴 **Critical** | 3,207 | Confirmed access control bypasses requiring immediate action |
| 🟠 **High** | 3,211 | Serious issues with clear exploitation paths |
| 🟡 **Medium** | 2,766 | Real findings with lower immediate impact |
| **Total** | **9,184** | |
A high critical count isn't a sign of failure — it means Perfai found real vulnerabilities before attackers did. The right response is triage and fix, not alarm. Use the Issues page to start working through critical findings.
***
## Security coverage
The **Security Coverage** donut shows how much of your mapped attack surface has actually been tested:
| Status | Count | Meaning |
| ------------------ | ------- | ----------------------------------------------------- |
| 🟢 **Covered** | 435 | Workflows and endpoints fully tested across all roles |
| 🟡 **Partial** | 40 | Some role combinations tested, not all |
| 🟠 **Uncovered** | 25 | Discovered but not yet tested — gaps in your coverage |
| **Total coverage** | **87%** | |
The goal is 100% covered. The **Partial** and **Uncovered** categories tell you exactly where your blind spots are. Check these in the individual app dashboards to understand why — usually it's a missing role credential or a workflow the Vision Agent hasn't fully mapped yet.
***
## Fixed issues
The **Fixed Issues** donut tracks how many vulnerabilities your team has remediated and had re-verified by Perfai:
| Severity | Fixed |
| --------- | ------ |
| Critical | 62 |
| High | 22 |
| Medium | 8 |
| **Total** | **92** |
An issue moves to "fixed" only after Perfai re-scans the endpoint and confirms the access control bypass no longer works. This is verified remediation — not self-reported.
***
## Bottom-row metrics
Total sensitive data types discovered across all apps — PII fields, financial data, internal IDs, and cross-user references. These are the data objects your access control model is supposed to protect.
Tracks how your total risk exposure changes over time. A rising trend means new issues are being introduced faster than they're fixed. A falling trend means your program is working.
How long it takes your team to fix a confirmed issue from discovery to verified resolution. 4 days is strong performance — industry average is weeks. Use this to benchmark your security engineering velocity.
Number of application releases tracked. Correlate this with your risk exposure trend to see whether new releases are introducing security regressions.
***
## Who should use Insights
| Role | What to look for |
| -------------------------- | ------------------------------------------------------------------ |
| **CISOs & security leads** | Bug bounty savings, active vulnerability count, coverage %, MTTR |
| **Engineering managers** | MTTR, fixed issues, risk exposure trend vs. release cadence |
| **AppSec engineers** | Uncovered endpoints, partial coverage, active critical/high counts |
| **Compliance teams** | Coverage %, fixed issues, OWASP mapping (via Issues page) |
***
## How to act on what you see
If coverage is below 90%, go to each app and confirm all roles are configured with valid credentials. Uncovered endpoints often mean a missing role.
Click through to the **Issues** page filtered by Critical severity. Sort by CVSS score and start with the highest. Each finding has a reproduction step — confirm it's real before assigning a fix.
If MTTR is rising, your fix pipeline has a bottleneck. Correlate with releases — if a specific deploy caused a spike, that release introduced regressions.
The bug bounty savings figure is the single most effective way to communicate the value of your security program to non-technical leadership. It converts risk into dollars.
## What is Insights?
**Insights** is your organization's security command center. While the Apps page shows you individual app status, Insights aggregates everything across your entire portfolio into a single dashboard — so you can answer high-level questions instantly:
* How much of our attack surface is actually covered?
* How many active vulnerabilities do we have right now?
* How fast are we fixing issues?
* What's our total financial risk exposure?
***
## Top-level metrics
The four headline numbers at the top tell the story of your security program at a glance:
Total secure and third-party apps under active testing. Every app Perfai monitors contributes to this count.
Total API endpoints mapped by the Vision Agent across all apps. This is your real attack surface — not an estimate.
Total security test scenarios executed. Each test probes a specific permission boundary across a workflow, endpoint, and role combination.
Estimated value of vulnerabilities found internally before external researchers or attackers discovered them. This is the ROI number to show your CFO.
***
## Active vulnerabilities
The **Active Vulnerabilities** donut breaks down your current open findings by severity:
| Severity | Count | What it means |
| --------------- | --------- | ------------------------------------------------------------ |
| 🔴 **Critical** | 3,207 | Confirmed access control bypasses requiring immediate action |
| 🟠 **High** | 3,211 | Serious issues with clear exploitation paths |
| 🟡 **Medium** | 2,766 | Real findings with lower immediate impact |
| **Total** | **9,184** | |
A high critical count isn't a sign of failure — it means Perfai found real vulnerabilities before attackers did. The right response is triage and fix, not alarm. Use the Issues page to start working through critical findings.
***
## Security coverage
The **Security Coverage** donut shows how much of your mapped attack surface has actually been tested:
| Status | Count | Meaning |
| ------------------ | ------- | ----------------------------------------------------- |
| 🟢 **Covered** | 435 | Workflows and endpoints fully tested across all roles |
| 🟡 **Partial** | 40 | Some role combinations tested, not all |
| 🟠 **Uncovered** | 25 | Discovered but not yet tested — gaps in your coverage |
| **Total coverage** | **87%** | |
The goal is 100% covered. The **Partial** and **Uncovered** categories tell you exactly where your blind spots are. Check these in the individual app dashboards to understand why — usually it's a missing role credential or a workflow the Vision Agent hasn't fully mapped yet.
***
## Fixed issues
The **Fixed Issues** donut tracks how many vulnerabilities your team has remediated and had re-verified by Perfai:
| Severity | Fixed |
| --------- | ------ |
| Critical | 62 |
| High | 22 |
| Medium | 8 |
| **Total** | **92** |
An issue moves to "fixed" only after Perfai re-scans the endpoint and confirms the access control bypass no longer works. This is verified remediation — not self-reported.
***
## Bottom-row metrics
Total sensitive data types discovered across all apps — PII fields, financial data, internal IDs, and cross-user references. These are the data objects your access control model is supposed to protect.
Tracks how your total risk exposure changes over time. A rising trend means new issues are being introduced faster than they're fixed. A falling trend means your program is working.
How long it takes your team to fix a confirmed issue from discovery to verified resolution. 4 days is strong performance — industry average is weeks. Use this to benchmark your security engineering velocity.
Number of application releases tracked. Correlate this with your risk exposure trend to see whether new releases are introducing security regressions.
***
## Who should use Insights
| Role | What to look for |
| -------------------------- | ------------------------------------------------------------------ |
| **CISOs & security leads** | Bug bounty savings, active vulnerability count, coverage %, MTTR |
| **Engineering managers** | MTTR, fixed issues, risk exposure trend vs. release cadence |
| **AppSec engineers** | Uncovered endpoints, partial coverage, active critical/high counts |
| **Compliance teams** | Coverage %, fixed issues, OWASP mapping (via Issues page) |
***
## How to act on what you see
If coverage is below 90%, go to each app and confirm all roles are configured with valid credentials. Uncovered endpoints often mean a missing role.
Click through to the **Issues** page filtered by Critical severity. Sort by CVSS score and start with the highest. Each finding has a reproduction step — confirm it's real before assigning a fix.
If MTTR is rising, your fix pipeline has a bottleneck. Correlate with releases — if a specific deploy caused a spike, that release introduced regressions.
The bug bounty savings figure is the single most effective way to communicate the value of your security program to non-technical leadership. It converts risk into dollars.